Rhodamine Concentration
2021
Background
One challenge associated with the use of limnocorrals to study the lake water column is uncertainty regarding the level of isolation produced by the limnocorral mesocosm. Complete isolation is not desirable, as this would produce an environment very different from that of the general lake water. By the same token, too much flow in and out of the mesocosms would diminish the experimental quality. In response to these concerns, we need to understand the flushing rate of the corrals. The flushing rate is a measure of how long it takes for the water inside a corral to be completely replaced by outside lake water due to natural movement of water in and out of the corral. Especially in experiments that involve dosing, such as our Aluminum Salts and Phosphorus Addition Experiments, it is essential for us to have a quality estimate of the flushing rate within the corrals. To better understand this, we dosed the corrals with rhodamine water tracer dye on two separate occasions and measured the resulting dilution time by collecting water samples from the corrals and analyzing the concentration of rhodamine using a fluorescence spectrophotometer.
Methods
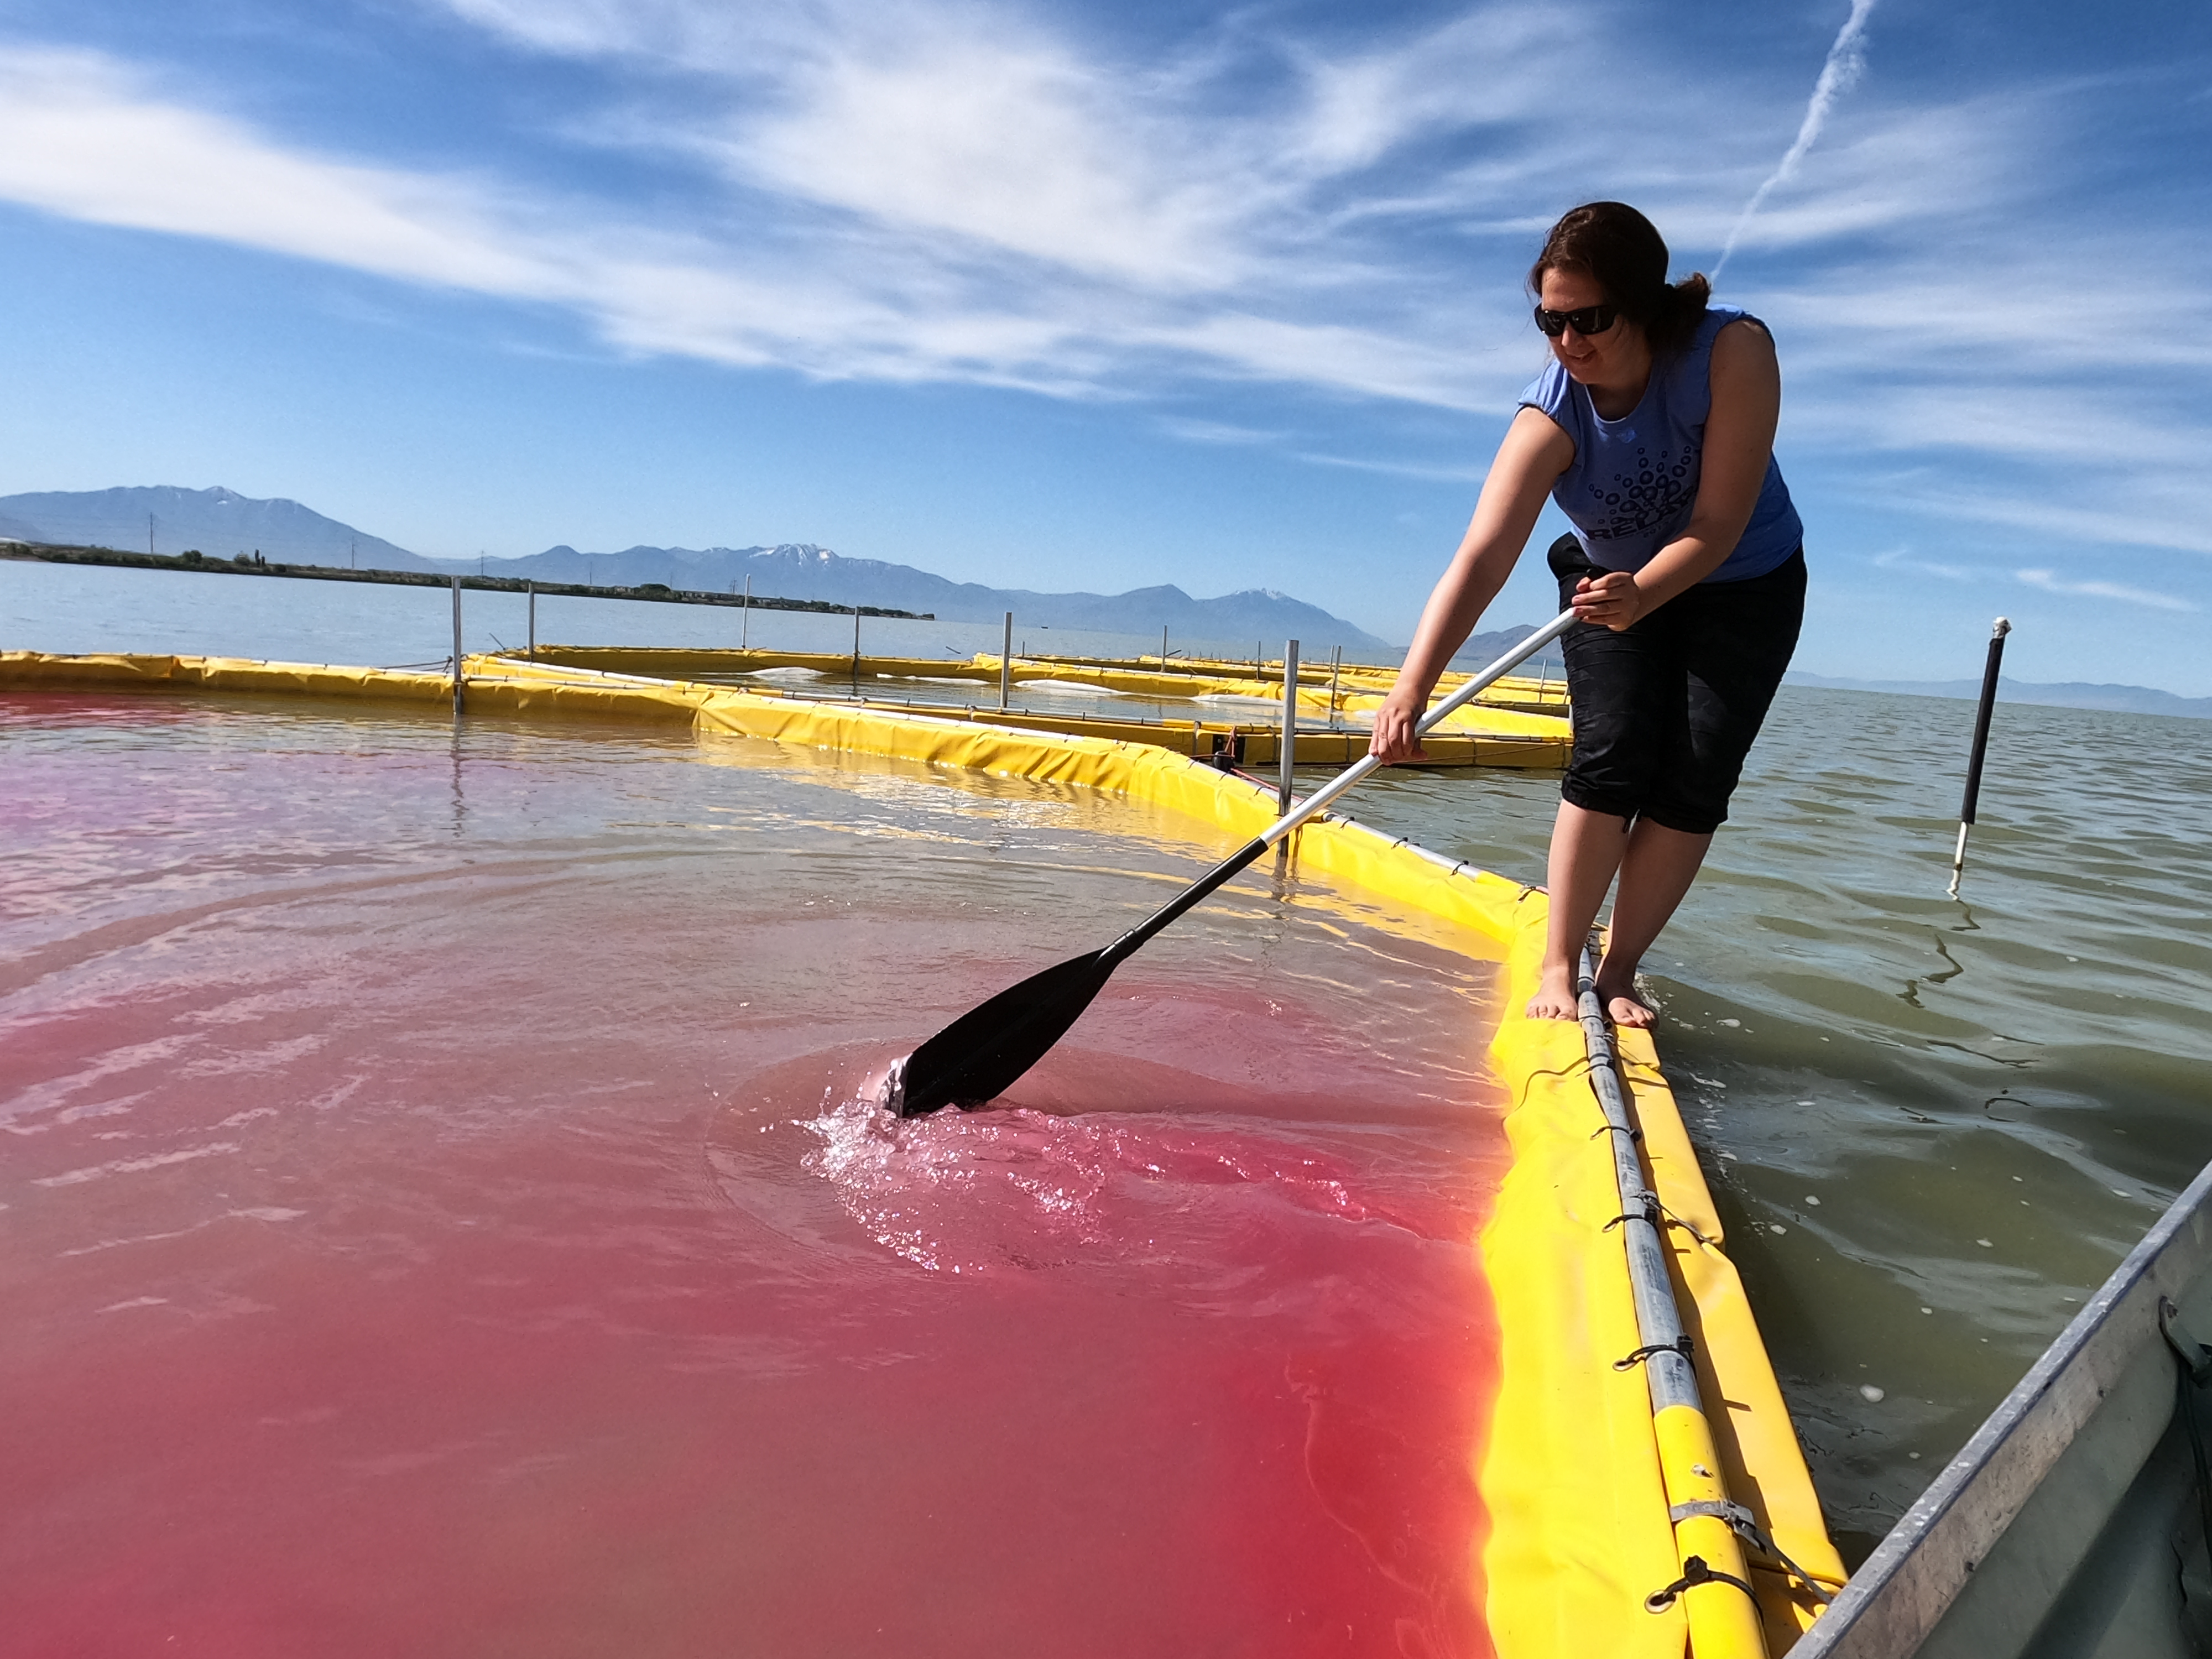
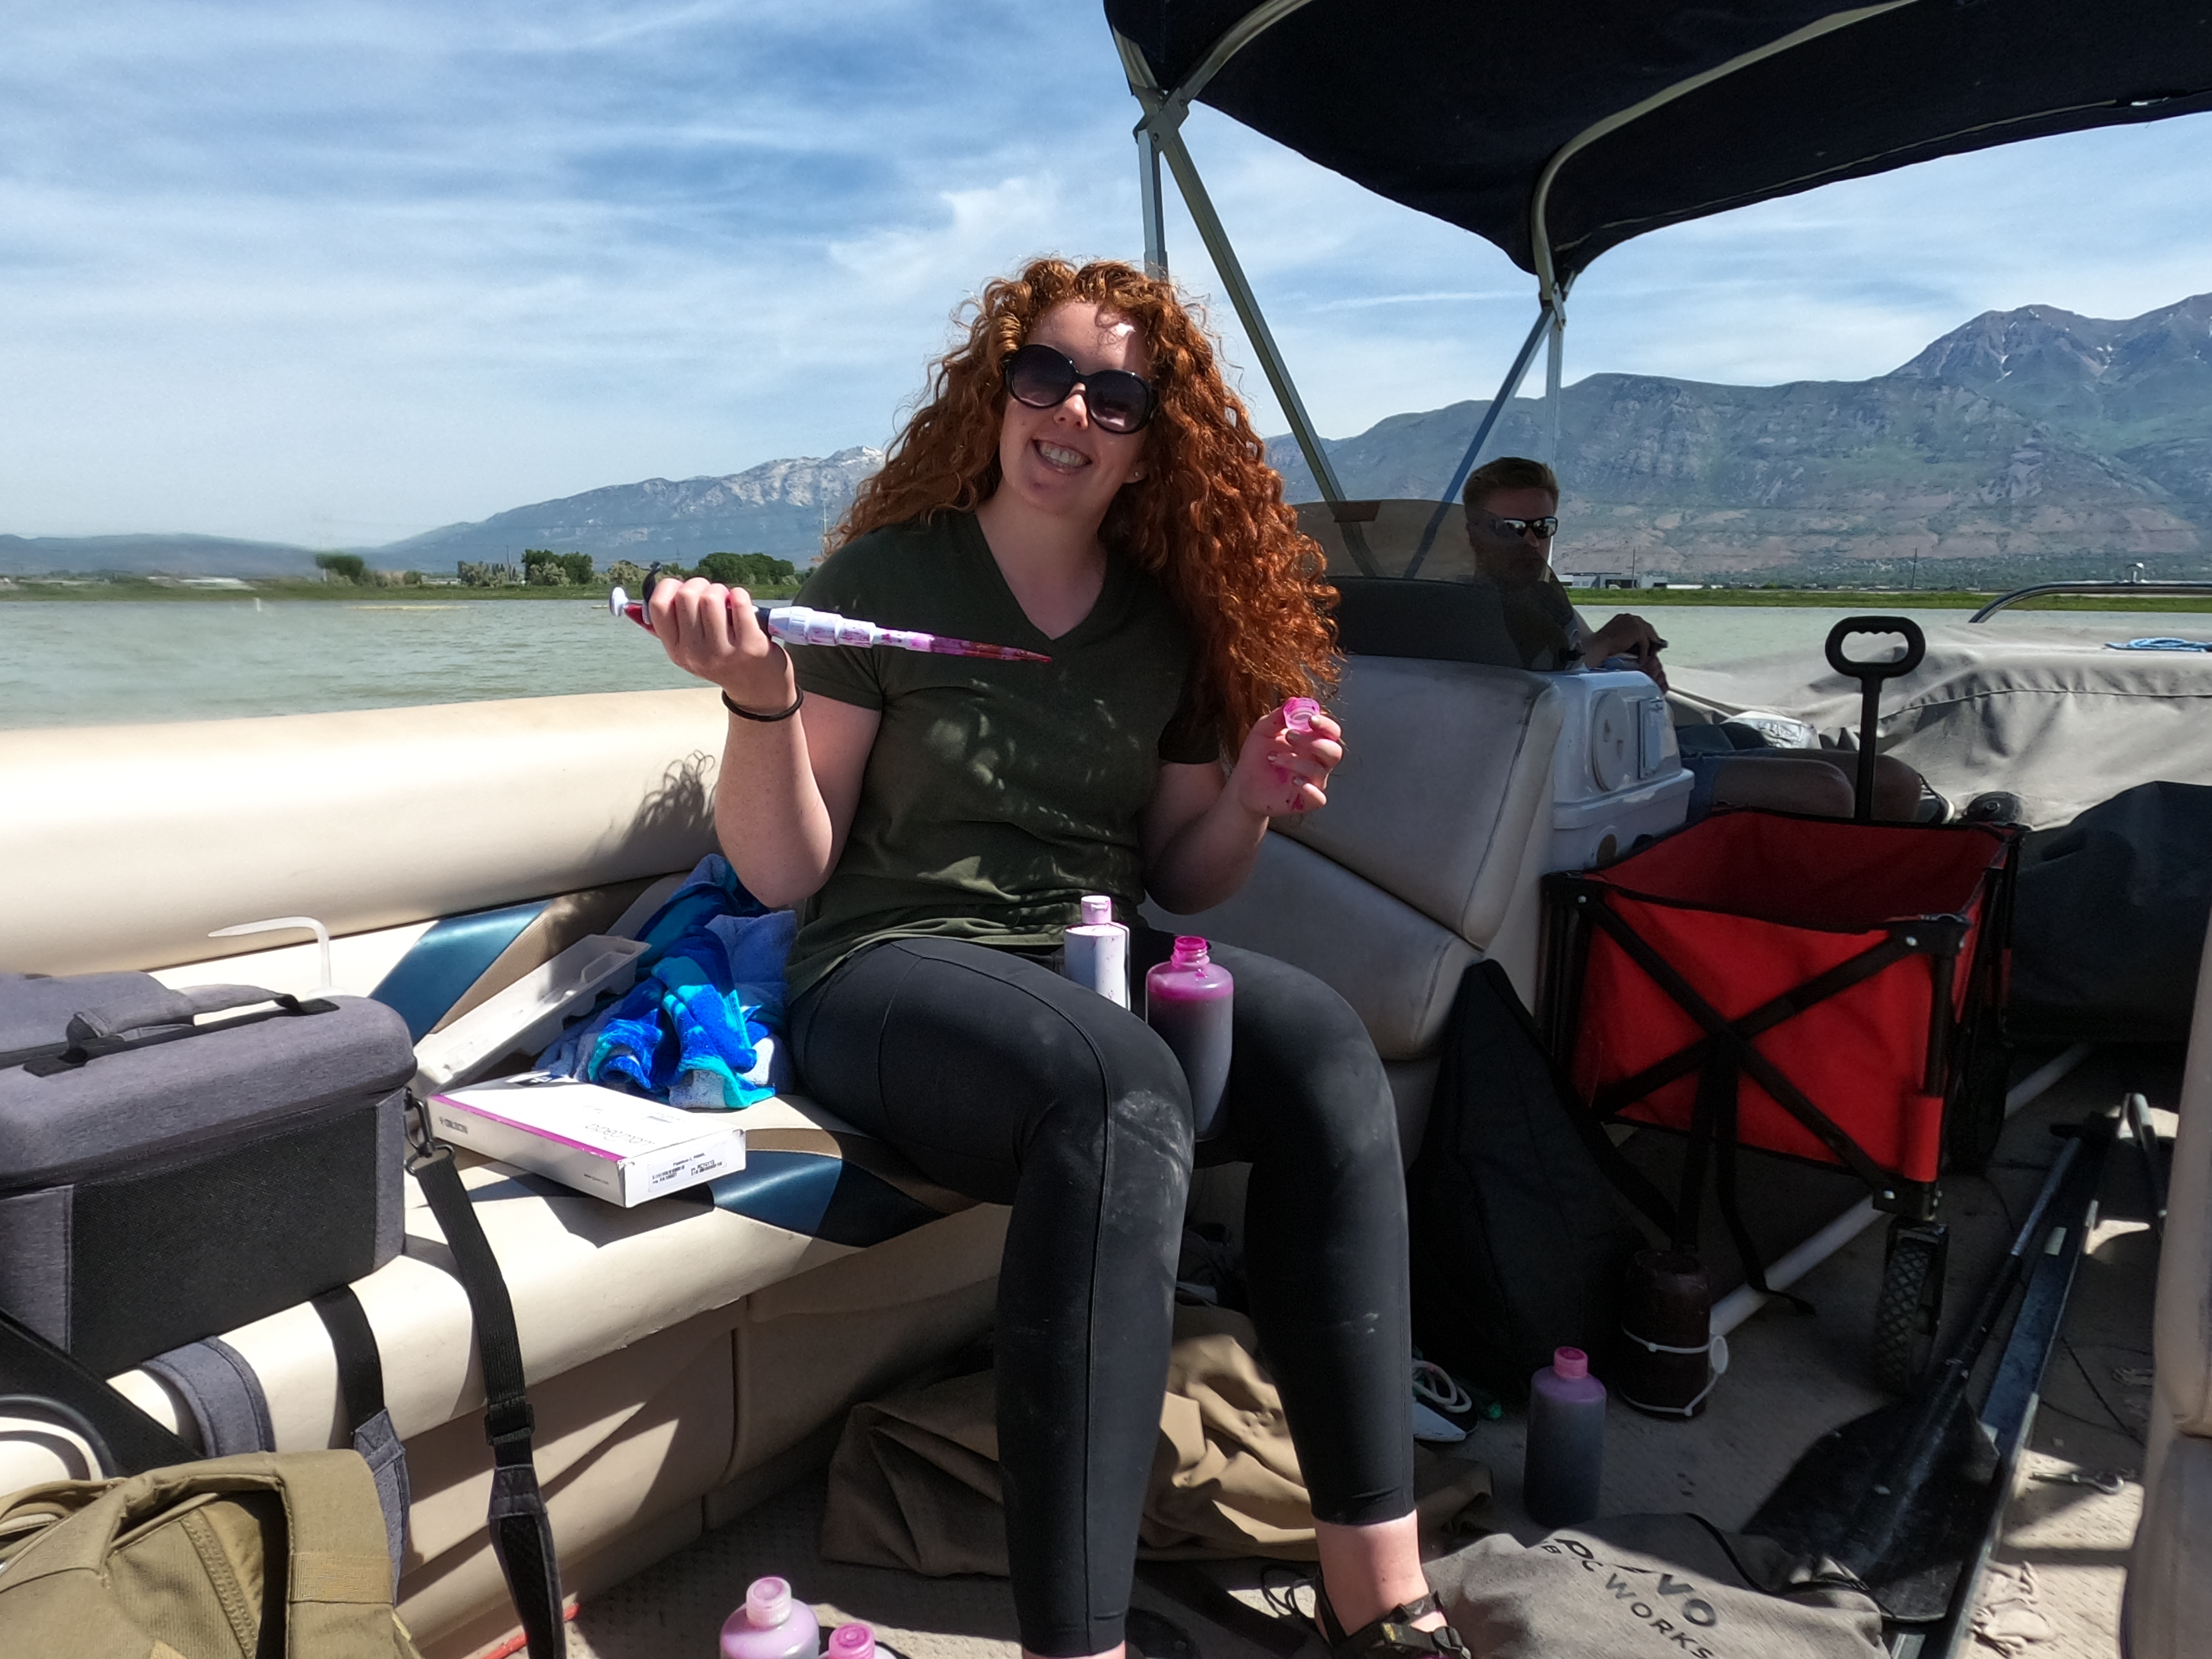
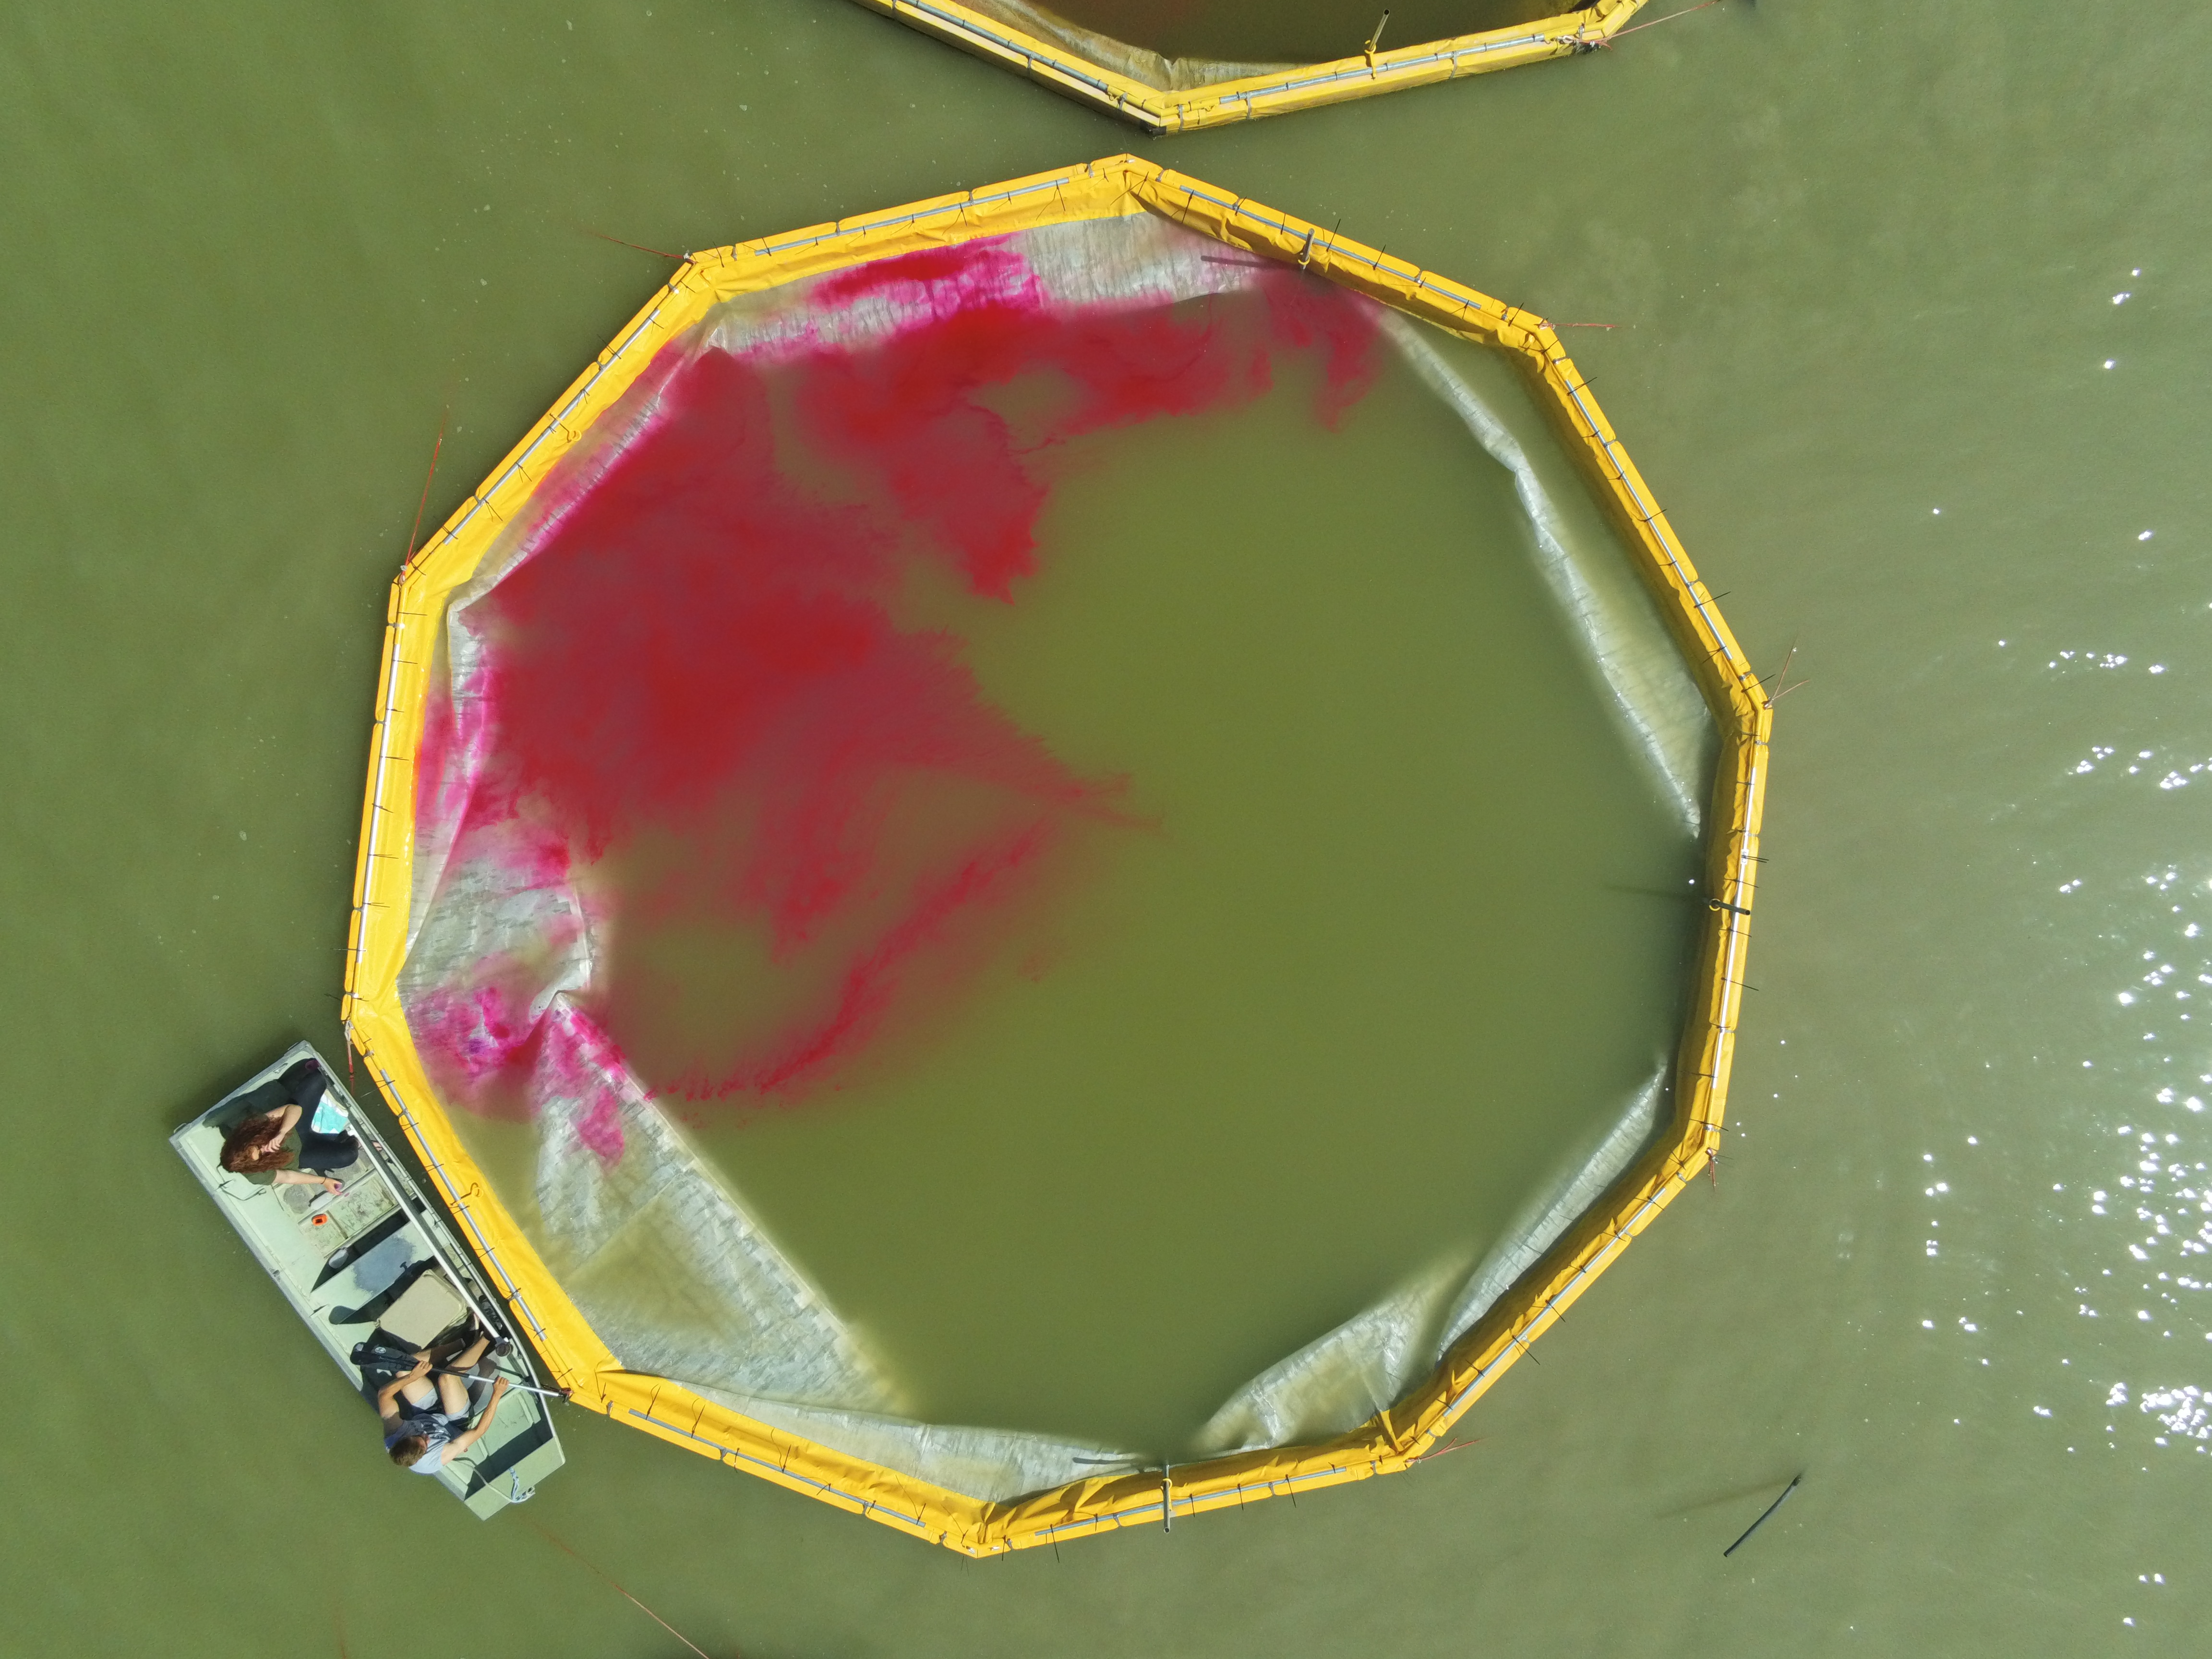
To measure the flow rates in the corrals, we used rhodamine, a fluorescent water tracer dye used for many water studies. Rhodamine is non-toxic and inert, so it does not affect biological and chemical processes in the water column. It is visible to the naked eye at concentrations of less than 100 ppb and it is observable on a fluorometer at even lower concentrations. We used the Fluorometric Procedures for Dye Tracing manual from the USGS to design our dilution experiment. To dose each corral, we filled 3-gallon pressurized sprayers with DI water and added aluminum salts and 10mL of rhodamine, then applied the mixture evenly to the surface of the water inside the corral. We dosed three corrals on the morning of September 6th 2021, and took measurements every 2 hours for the rest of the day, and then daily for the next 7 days.
Results
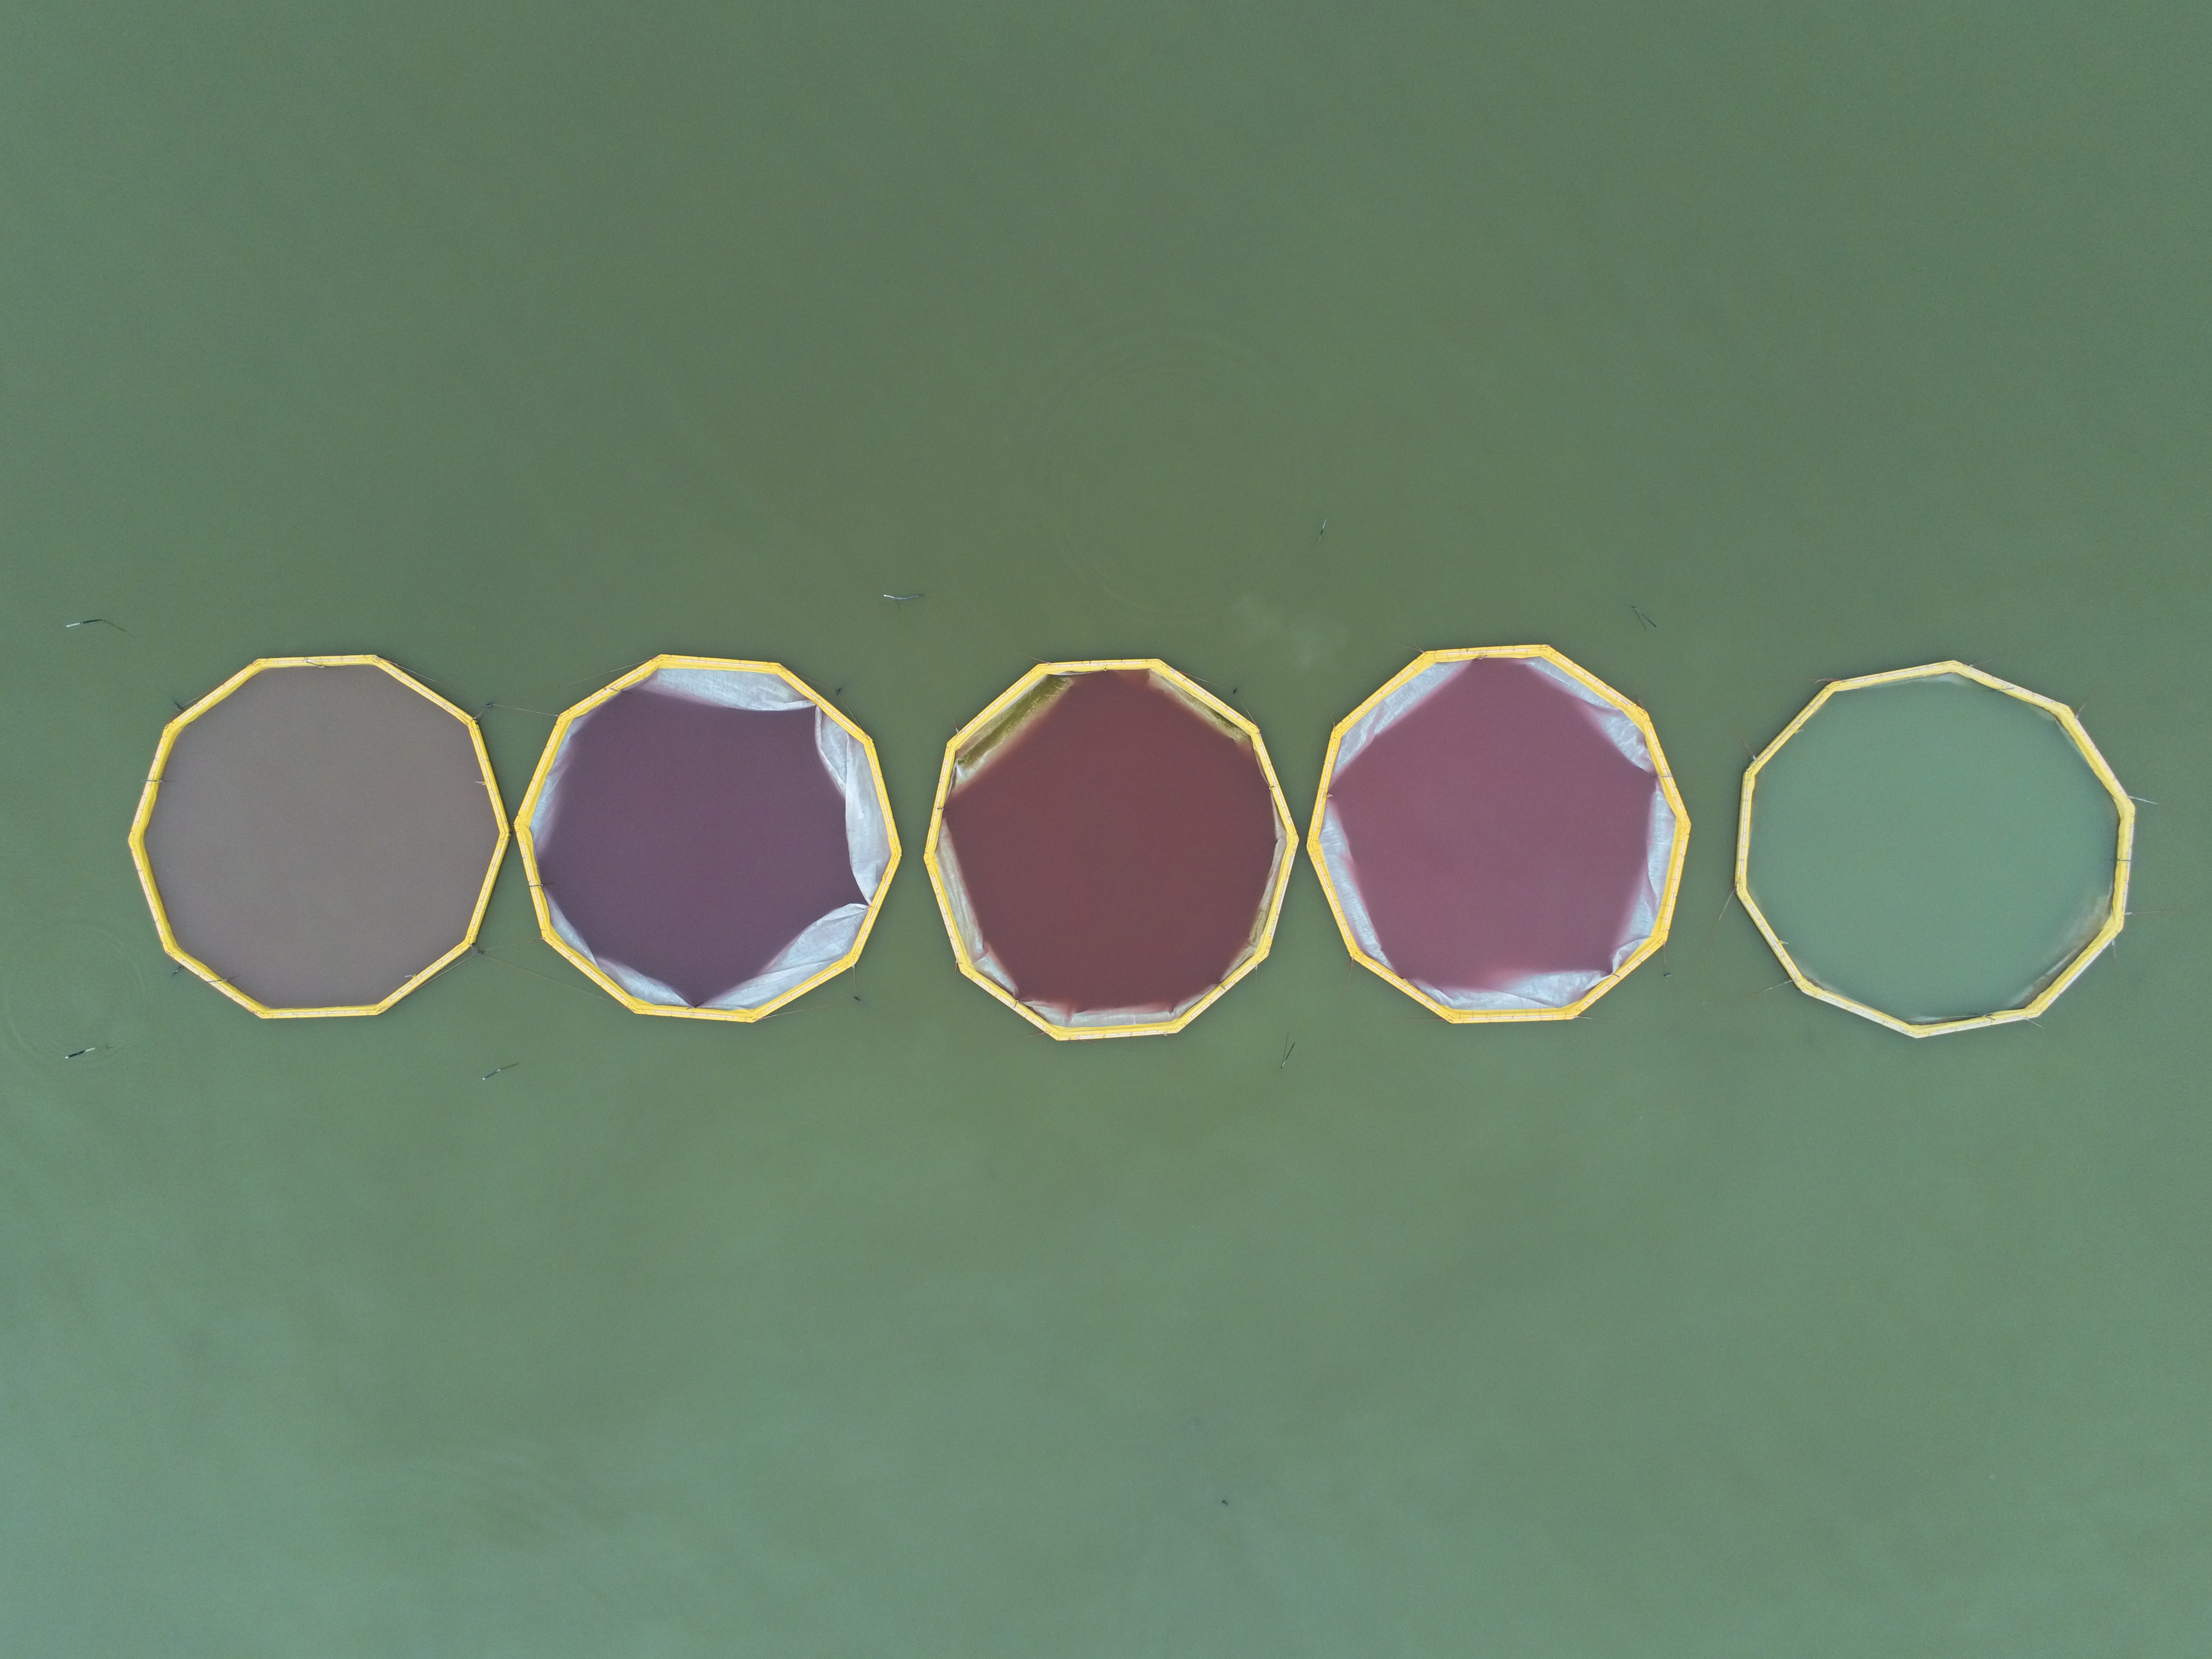
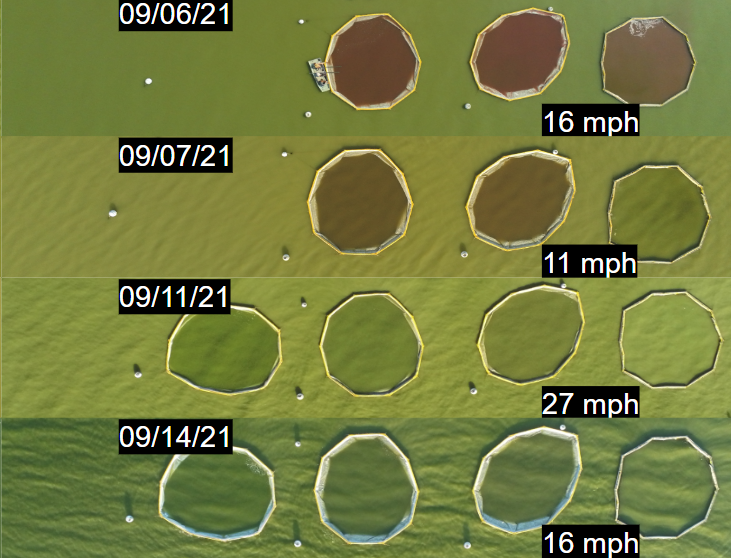
Although we added just 10mL of rhodamine to the 100,000L corrals, the water was noticeably pink for several days after dosing. The day we dosed was very calm and warm, and the water column was not well-mixed. The dye remained in the top two feet of water in the corrals for most of the day, which means that the concentrations we measured that day did not accurately reflect the concentration in the entire corral. By the next day, however, the water was thoroughly mixed, and successive sampling yielded reasonable dilution curves.
The figure below shows the results of the samples collected on the day of dosing and for two days afterwards. Values are plotted as percentages of the initial concentration, as measured on the fluorometer according to the USGS procedure.
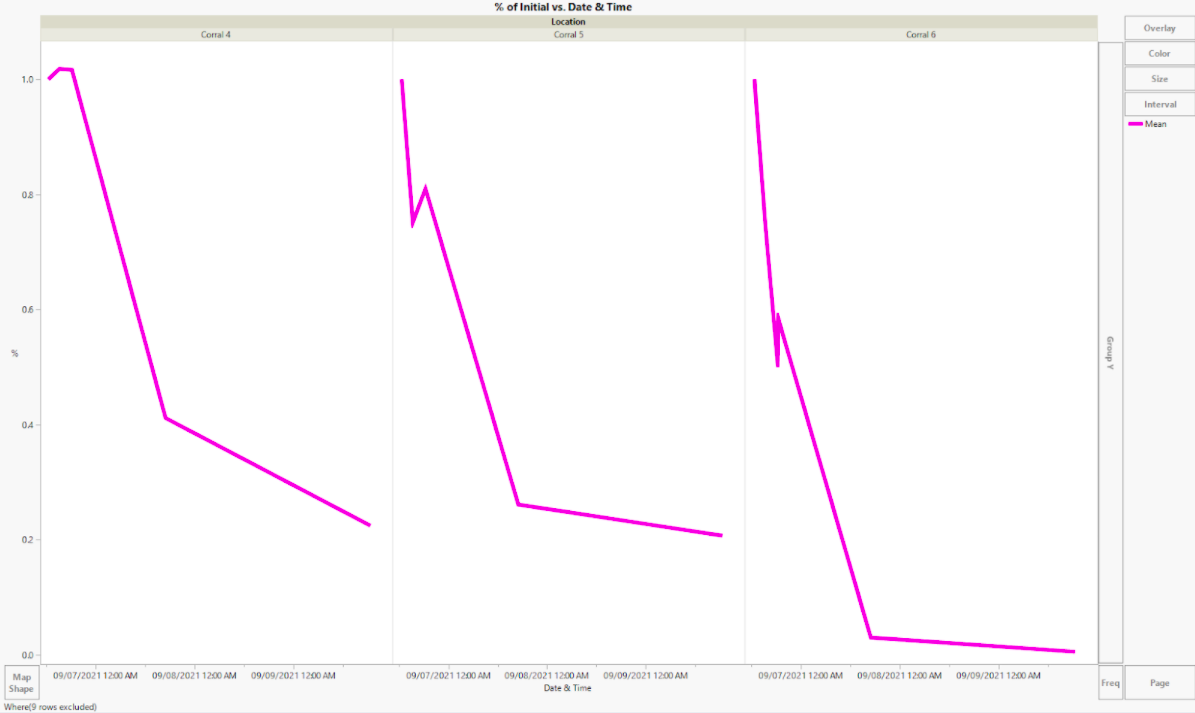
These results indicate that the flushing time in the corrals is quite short. Because the corrals were stratified on the first day, however, the concentrations in the surface water from which samples were collected were artificially high. This made the concentrations appear lower on successive days, when the dye was mixed throughout the entire corral. Another known issue is that sunlight degrades rhodamine, which means that the concentration levels likely decreased faster than they would have if they had decreased solely through dilution.
These two factors mean that the actual flushing time in the corrals is likely longer than what we observed, possibly around 3-6 days. The difference in the shape of the dilution curve for Corral 6 could be due to the fact that the turbidity of the water in Corral 6 was significantly higher for the duration of this experiment, which could have impacted the apparent color of the dye and the readings on the fluorometer.
Conclusions
Further dilution experiments are necessary to get a more accurate estimate of the flushing rate in the corrals, but for now we know that complete turnover of water in the corrals occurs in a matter of days. This is a good flushing rate for the experiments we are conducting because it is not so slow that the environment inside the corrals significantly affects water column processes, but not so fast that our experiments are diluted before we can measure their effects.
References
Division of Kingscote Chemicals. Technical Data Bulliten. Bright Dyes. https://www.kingscotechemicals.com/wp-content/uploads/2020/07/TD-FWT-Red-25-Products.pdf
Wilson JF, Cobb ED, Kilpatrick FA. Flourometric Procedures for Dye Tracing.USGS: Science for a Changing World. https://pubs.usgs.gov/twri/twri3-a12/
BYU Environmental Engineering Laboratory

Dept. of Civil and Environmental Engineering